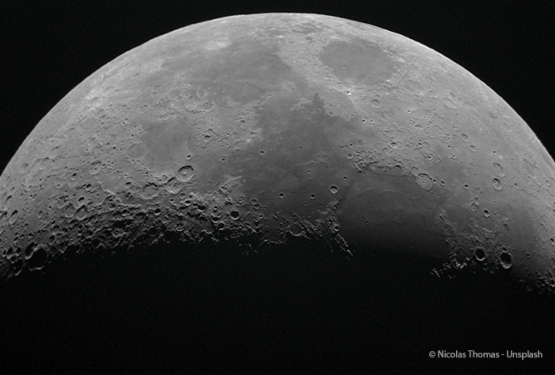
RESEARCH ON OUR SITE


Medium-range order changes in a fused silicate: the first step towards crystallisation

(in-situ x-ray diffraction and absorption measurement at high temperature)

SOLEIL Company Contents > All the news > News 2009 > Silicate

E. Strukelj1, D.R. Neuville1*, B. Cochain1, L. Hennet2, D. Thiaudière3, B. Guillot4, M. Roskosz5, M. Comte6 et P. Richet1
1 Physique des Minéraux et Magmas, CNRS-IPGP, 4 place Jussieu, 75252 Paris Cedex 05  - *contact : neuville@ipgp.jussieu.fr
2 CEMHTI-CNRS, Orléans
3 SOLEIL, Orme des cerisiers, St Aubin
4 Laboratoire de Physique Théorique de la Matière Condensée, Université Pierre et Marie Curie (Paris 6), UMR CNRS 7600, 4 place Jussieu, 75252 Paris Cedex 05, France
5 LPTSE, Université de Lille, Villeneuve d’Asq
6 Corning SAS CETC 77210 Avon

Ice formation, the crystallisation of igneous rock, and metallurgical and vitroceramic processes are a few examples which illustrate the importance of the crystallisation of liquids in natural and industrial processes. On a microscopic scale, however, the structural rearrangements that characterise the initial stages of the crystallisation of an amorphous material are not well understood. This leaves tremendous scope to improve the control and the understanding of crystallisation, particularly at high degrees of supercooling, where the transformation is highly irreversible. This is the context in which we decided to study medium-range changes of order occurring in a fused silicate starting to crystallise in the presence of a nucleating agent. A calcium aluminosilicate was chosen for the study because of the major geological and industrial importance of these liquids. Zirconium oxide (ZrO2) was chosen as the nucleating agent. In order to examine both the overall structure of the liquid and the order around the nucleating agent, the x-ray scattering measurements were supplemented by x-ray experiments at the K threshold of Zr.


Description of the experiments

The apparatus used on the DIFFABS beamline is represented in Fig. 1. The x-ray absorption measurements at the K threshold of Zr were performed both in transmission and in fluorescence. The scattering measurements were carried out in transmission, which involves major geometric corrections to calculate the correlation functions, G(r).

The compound being examined is located at the middle of the SiO2-Al2O3-CaO diagram, with a 0.07 molar fraction of ZrO added to it. The initial glass is manufactured by drying, weighing, grinding and melting the initial oxides and carbonates in the desired proportions. These are then fused and ground three times to obtain a uniform glass. The glass obtained is placed in the hole (800 microns) of a micro-oven which has been used before, on the LUCIA beamline (Neuville et al., 2008), so that the sample can be heated via the Joule Effect to 1700°C using a Pt/Ir10% wire or to 2600°C with a pure Ir wire.

Figure 1 : Hot wire assembly in the x-ray scattering set-up
on the DIFFABS beamline.


X-ray absorption at the K threshold of Zr at high temperature

The x-ray absorption spectra at the K threshold of Zr vary according to whether the glass is at ambient temperature or in the liquid phase at 1373 K and, for this latter case, whether obtained in transmission or fluorescence (Fig. 2a). The XANES spectrum at the K threshold of Zr in glass has a significant white line and only one EXAFS peak, which characterises a long-range absence of order. At 1373 K, the spectra contain the same white line, but it is followed by a series of very distinct oscillations which imply a change of order in the distribution of Zr in the liquid due to partial crystallisation of the sample or structural reorganisation around Zr. The spectral difference visible between transmission and fluorescence is explained by the fact that the whole sample is analysed in transmission, whilst in fluorescence only the surface is probed over approximately ten microns. The fact that the oscillations observed in transmission were more distinct than those in fluorescence therefore simply means that the sample is more crystallised at its core than on the surface.


Figure 2 : (a) Absorption spectrum at the K threshold of Zr for glass and for the annealed liquid at 1373 K in transmission and fluorescence,
(b) Absorption spectra at different temperatures up to liquidus.

Figure 2b shows the spectra obtained at different temperatures from glass to a stable liquid. The same changes as those in Figure 2a are clearly observed. The white line varies little with temperature, whilst the oscillations increase after the glass transition because of partial crystallisation of the sample. The spectrum of the liquid beyond liquidus is similar to that of glass, and is therefore characteristic of a homogeneous phase from which any long-range order is absent.


X-ray scattering at 17.5 keV

X-ray scattering experiments were performed at 17.5 keV for glass, the stable liquid at 1873 K, and the partially crystallised liquid (Fig. 3). The unusual geometry of the oven makes it rather complicated to acquire these spectra. Some tricky adjustments are required in order to eliminate all of the filament diffraction peaks. Its takes two hours to acquire a spectrum, which means that the apparatus must have tremendous thermal stability for high-temperature experiments, in this case at 1873 K. The spectra of the samples annealed for 15 and 50 minutes at 1173 K were obtained at ambient temperature after quenching.

Figure 3 : X-ray scattering spectrum at 17.5 keV for glass, the stable liquid at 1873 K, and the partially annealed glass at 1173 K. Diagram of ZrO2 corresponding to the Bragg peak visible in the annealed liquid at 1173 K.
The spectra at different temperatures show a major peak at 15° followed by two more diffuse peaks at 20 and 30° before the intensity gradually decreases. The spectrum of the liquid at 1873 K is again similar to that of the glass at ambient temperature, in accordance with the homogeneous amorphous nature of the two samples. The spectrum of the overmelted liquid annealed for 15 minutes at 1173 K does not display any significant change with respect to those of glass and liquid. On the other hand, the product obtained after annealing for 50 minutes at 1173 K shows Bragg peaks which are characteristic of the ZrO2 phase which crystallises at this temperature. The pair correlation functions G(r) are determined from the diffraction diagrams of the glass and the liquid. These diagrams provide some insight into the structural changes occurring in the liquid in the neighbourhood of the glass transition temperature and in the nucleation domain. Figure 4 shows these correlation functions G(r) for glass, the overmelted liquid annealed for 15 minutes at 1173 K and, for the first time a G(r) for a stable liquid at 1873 K. Although it is not easy to interpret all the G(r) functions, in Figure 4 we provide a suggested attribution for the various peaks. Some significant changes are observed between the glass and the liquid. The 2.38 Å peak, which represents the Ca-O distances, is visible in the G(r) for glass, but disappears at higher temperatures. The peak at 2.09 Å, which represents the Zr-O distance, is more visible in the liquid than the glass, because it coincides more with the 1.74 Å peak attributable to Si-O and Al-O. The annealed liquid at 1173 K also displays significant changes, particularly for the Ca-O and Zr-O distances. These changes are the result of a reorganisation of the liquid before the nucleation/crystallisation of the phases whose diffraction peaks are shown in Figure 3 for the liquid annealed at 50 minutes at 1173 K.


Figure 4 : G(r) at different temperatures for glass, liquid, and liquid annealed for 15 minutes at 1173 K, with identification of the various peaks.
 

Conclusions

These very promising experiments were carried out on the DIFFABS beamline, which is ideally suited to this type of high-energy experiment involving the diffraction and absorption of x-rays. The x-ray absorption and diffraction clearly show medium-range changes of order around Zr atoms before and during nucleation.

Accueil