➊
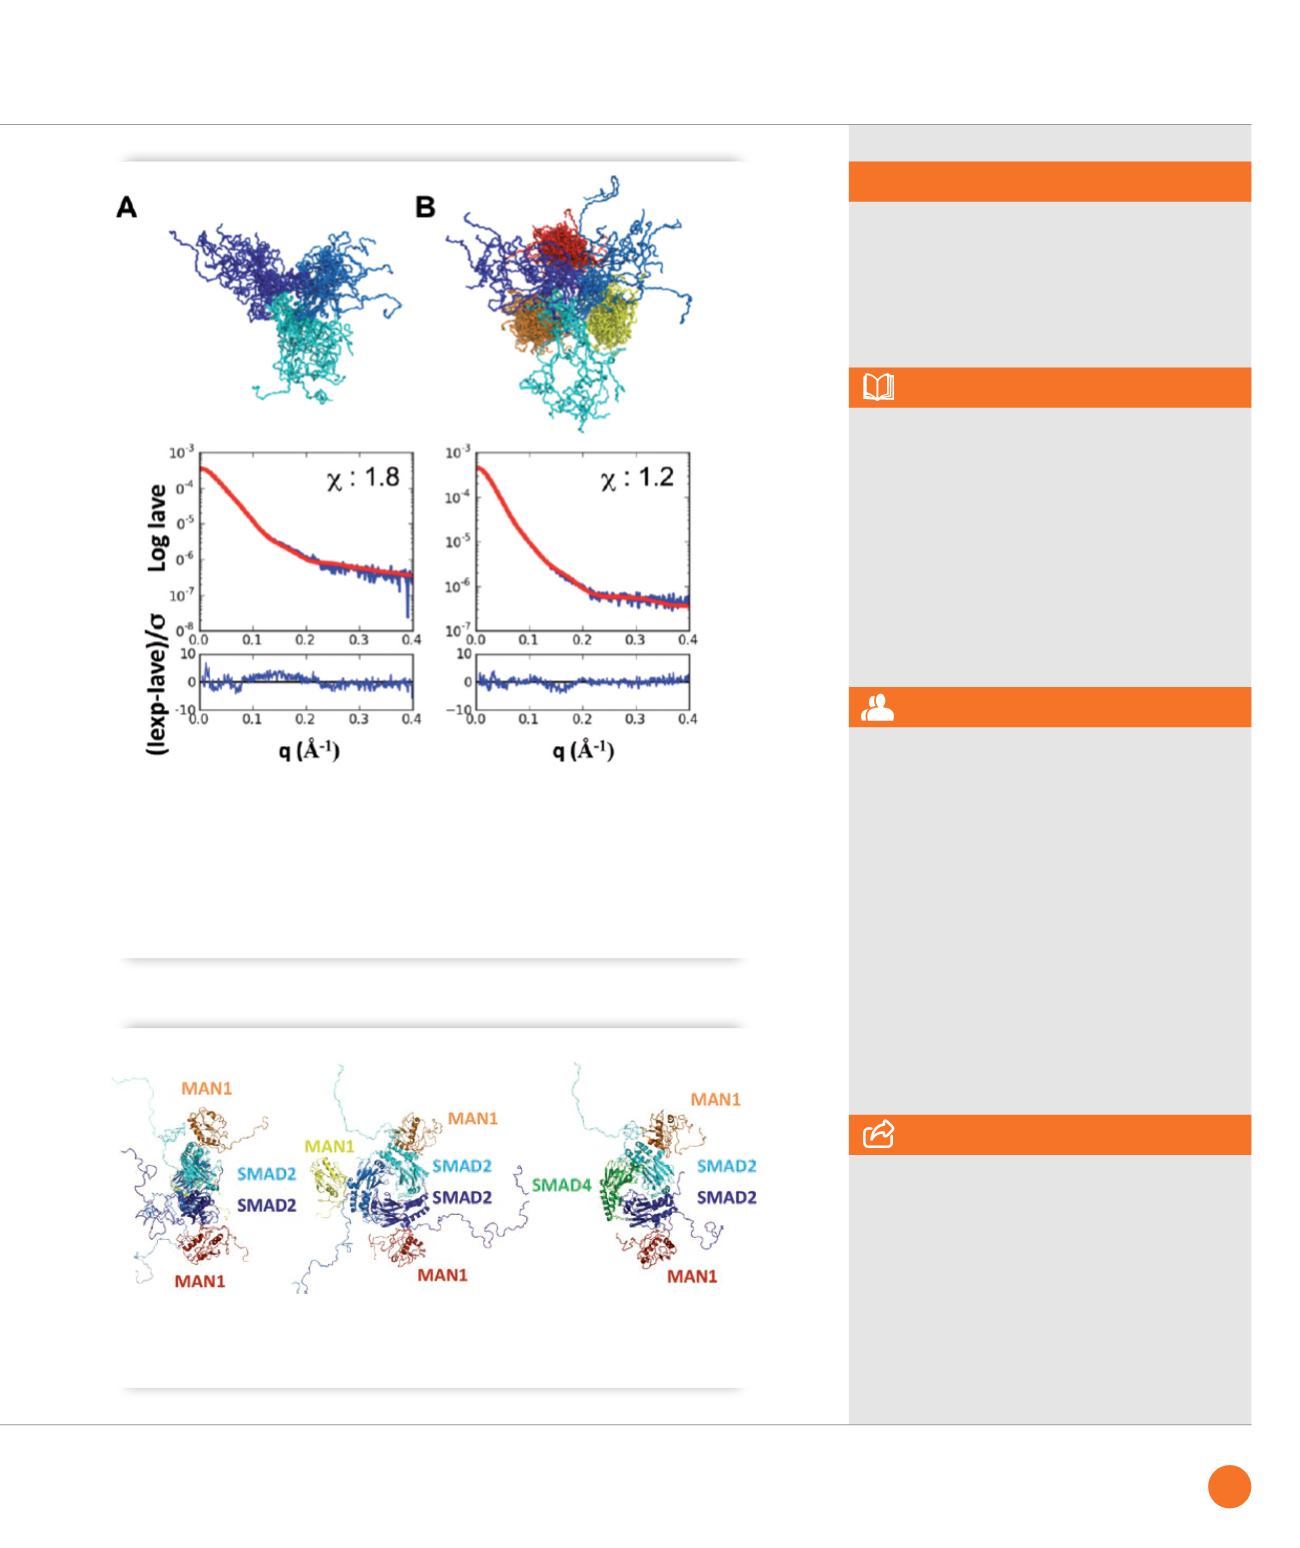
Models of the phosphomimetic Smad2 fragment either free (
A
) or in complex (
B
) with the MAN1 fragment
obtained from SAXS data. In each panel, 20 models of the trimeric Smad2 fragment are superimposed (each
monomer colored in a different shade of blue). In (
B
), a MAN1 fragment is bound to each Smad2 fragment (each
MAN1 fragment colored in yellow, orange and red, respectively). Curves show the corresponding fit between the
calculated SAXS intensity averaged on the 20 models (Iave; red) and the experimental SAXS intensity (Iexp; blue).
The chi values confirm that the deviations between the calculated and experimental intensities are close to the
experimental error. The difference between the two intensities divided by the experimental error is also plotted as
a function of the diffusion vector amplitude. In both panels, this difference is regularly distributed around 0 on the
whole q interval, as expected for a random noise-like signal.
➋
Smad2 can simultaneously bind to MAN1 and Smad4. Two orthogonal views of a typical MAN1-Smad2
complex, and a view in which one of the Smad2 MH2 monomers was replaced by a Smad4 MH2 monomer.
SWING beamline
ASSOCIATED PUBLICATION
Inhibition of TGF-
β
signaling at the nuclear
envelope: characterization of interactions
between MAN1, Smad2 and 3, and PPM1A
B. Bourgeois, B. Gilquin, C. Tellier-Lebègue,
C. Östlund, W. Wu, J. Pérez , P. El Hage,
F. Lallemand, H. J. Worman and S. Zinn-Justin*
Sci Signal. 6(280):ra49 (2013)
REFERENCES
[1] Arib & Akhtar, Curr Opin Cell Biol
23 (2011), 346
[2] Towbin et al., Trends Biochem Sci
38 (2013), 356
[3] Worman & Bonne, Exp Cell Res
313 (2007), 2121
[4] Krimm et al., Structure 10 (2002), 811
[5] Caputo et al., J Biol Chem 2006 281, 18208
[6] Kondé et al., Biochemistry 49 (2010), 8020
* Laboratoire de Biologie Structurale
et Radiobiologie, CEA IBITECS
& Université Paris Sud / CNRS UMR 8221,
CEA Saclay Bât 144, 91190 Gif-sur-Yvette,
France
CORRESPONDING AUTHOR
59
SYNCHROTRON
HIGHLIGHTS
2013


