Understanding the mechanisms of X-ray radiation damage in biological systems is of prime interest in medicine (radioprotection, X-ray therapy...). The soft X rays, with an energy between 100 - 1000 eV, can pull out electrons strongly bound to the atoms constituting the organic matter – this is the ionization phenomenon. This ionization is followed by the emission of a second electron (“Auger electron”). However, in a solution, those two electrons can induce damage. Are we able to identify these emitted electrons and their history?
To answer this question, a team from LCP-MR (Paris) has designed a magnetic bottle time-of-flight electron spectrometer coupled to the PLEIADES beamline liquid micro-jet. So-called coincidence measurements allowed to distinguish the consequences of the ionization of two carbon atoms with a different chemical environment.
The exposure of a molecule to an ionizing radiation such as X-rays induces the emission of an electron, coming from the core electronic layers, called photoelectron (e-ph). The molecule left in an excited state (with a "hole" in the inner electronic layer) can then relax by the emission of a second electron, the Auger electron (e-Auger). These ultra-fast processes occur in the femtosecond range (10-15s) after the interaction with the photon. Electron spectroscopy, allowing the analysis of the kinetic energy of the emitted electrons, is a tool of choice to study these phenomena. Nevertheless, even for isolated molecules (gas), Auger electron spectra are difficult to interpret because of the many possible de-excitation pathways produced by each e-ph. In liquid media, additional interactions induced by the solvent complicate further the analysis of the measured spectra.
To promote the understanding and consequently the distinction of each process, two conditions must be completed. The first is to obtain a clear identification of the contribution of the solvent electrons from that of the solvated molecule electrons. The second is the distinction of the different Auger processes that took place following the ionization of several atoms within the same molecule. The method of coincidence measurements, whose principle is represented schematically on Figure 1, is particularly adapted since it allows to find the electron pairs (here e-ph / e-Auger) resulting from the same ionization event. As described in Figure 1, this method gives access to Auger spectra filtered over a range of kinetic energy, not accessible by a classical electron spectroscopy measurement.
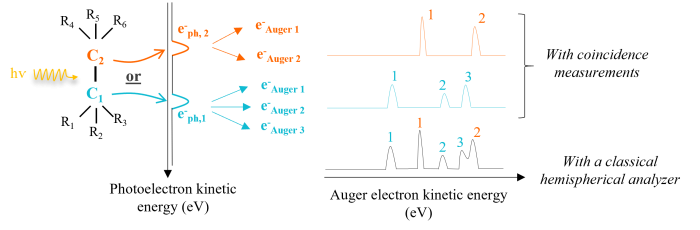
Figure 1: Schematic of the coincidence measurement principle for a molecule with two carbons having non-equivalent chemical environments. We distinguish two Auger processes, each following the emission of e-ph,1 or e-ph,2.
Experimentally, coincidence measurements can be performed with a magnetic bottle spectrometer which must be used with a special synchrotron mode called "single bunch", i.e. a single bunch of particles circulates in a part of the accelerator, producing one single radiation flash. The synchrotron clock, set on this flash, triggers the time-of-flight measurements of the electrons towards the detector. This time is directly related to the kinetic energy of the electrons.
In parallel, the application of this technique to a liquid sample implies the implementation of a liquid micro-jet device. The scientific teams combined these two techniques to study sodium benzoate molecules solvated in water, represented schematically in the micro-jet on Figure 2. This molecule is composed of two different chemical groups: the aromatic group whose carbons are identified by blue spheres and the carboxyl group for which the carbon is identified by an orange sphere. At the PLEIADES beamline, the measurements were performed using an X-ray energy higher than the threshold of the electronic 1s layer of the element carbon . The results obtained are given in Figure 2.
Due to the presence of two different chemical environments for carbon, two peaks on the photoelectron spectrum are identifiable (photoelectron spectrum, left). Similar to what is presented in Figure 1, two Auger spectra filtered over the photoelectron energy range were obtained (spectra under the 2D mapping). The observed differences between these two spectra can be considered as a concrete illustration of the interest of coincidence measurements. Theoretical calculations are needed to explain these differences.
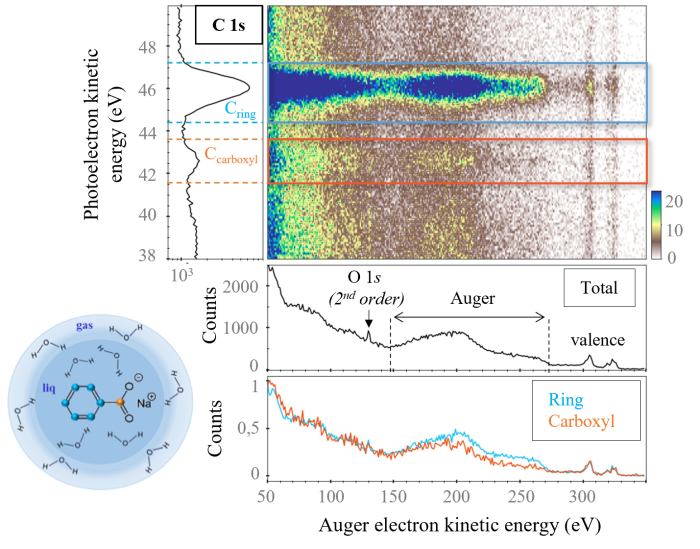
Figure 2: 2D kinetic energy (e-Auger) vs kinetic energy (e-ph) mapping of coincidences for solvated sodium benzoate. The number of coincidences is given by the scale on the right. The total Auger spectrum and the energy filtered Auger spectra are shown.
These encouraging results will help to determine the energy distributions of electrons emitted into the liquid that can cause damage and thus serve as input data for simulations. This method also probes the energy transfers between the solute and the solution.