➊
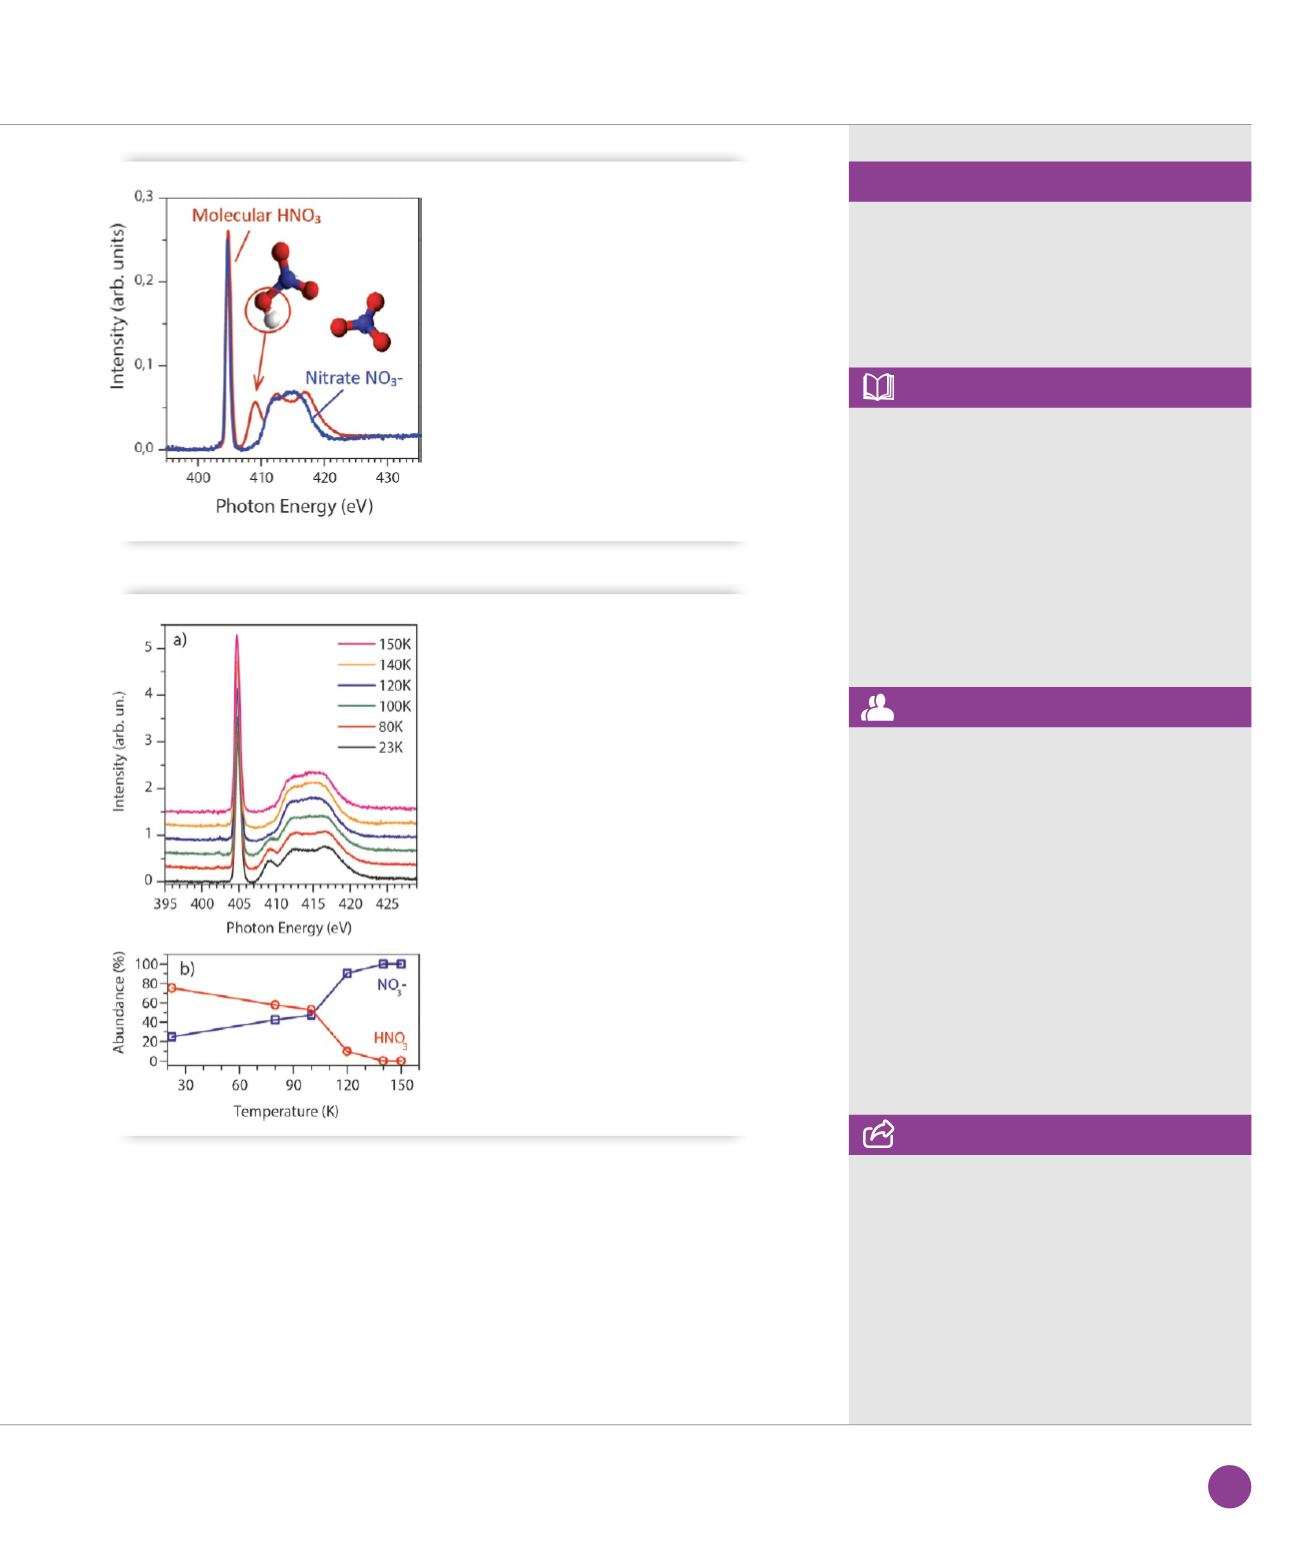
N K-edge NEXAFS spectrum of molecular HNO
3
(red).
The arrow indicates the transition specific to OH,
absent in the dissociated form NO
3
-
(blue).
➋
(a)
N K-edge NEXAFS spectra of 0.4 monolayer
of HNO
3
adsorbed on ice at 23 K, then progressively
warmed at 150 K. (b) Quantitative analysis of the data
allows the estimation of the relative abundance
of HNO
3
and NO
3
-
as function of the temperature.
TEMPO beamline
ASSOCIATED PUBLICATION
Nitric acid at the surface of amorphous
solid water revealed by X-ray absorption
spectroscopy
G. Marcotte, P. Ayotte, A. Bendounan,
F. Sirotti, C. Laffon, and P. Parent*
Journal of Physical Chemistry Letters
4(16) (2013) 2643
REFERENCES
[1] F. Dominé et al. Science 297 (2002), 1506
[2] C. Zhu et al. J. Phys. Chem.
A 114 (2010), 2561
[3] P. Ayotte et al. J. Chem. Phys.
123 (2005), 184501/1
*Aix Marseille Université, CNRS, CINaM UMR
7325, campus de Luminy, case 613, 13288
Marseille, France
CORRESPONDING AUTHOR
23
SOLEIL
HIGHLIGHTS
2013


