Photoemission spectroscopy: what do the angular distributions of electrons tell us
In a recent paper published in Physical Review an international group of scientists demonstrated that laboratory frame electron angular distributions can be used as a tool to probe the chemical environment of the atom from which electron was emitted. The researchers measured electrons emitted from gas-phase chloroethane molecules at two different angles (0° and 90°) with respect to the polarization vector of the synchrotron radiation, and from these measurements they extracted so called photoelectron asymmetry parameter b. The b parameter was observed to vary remarkably, depending on how many chlorine atoms were present in the molecule. Supported by high-level theoretical calculations the researchers suggested a physical picture for the observed behavior of the asymmetry parameter, where the photoelectron scattering plays an essential role.
Many electron spectroscopists agree that angular distributions are among the trickiest, but most informative observables (measurable quantities) in their field. What is the meaning of angular distribution in electron spectroscopy? It is the distribution of directions where electrons are emitted within a specific coordinate system. Does it feel counterintuitive that electrons emitted from a randomly oriented gas-phase sample (even the heaviest molecules studied in this work are flying through the spectrometer with over 800 km/h while also spinning) exhibit some specific spatial directions where there are more electrons detected than in some other places? If you answered yes you are on the right track and, please, keep reading. Let us try to understand what is going on! There are some key points that we have to consider here: 1) how the emitted electron feels the movement of the molecule 2) what might be the specific coordinate system mentioned above.
Let us try answering these questions by starting with the easy one first: on the time scale of the electron emission, the molecules are almost staying still. Molecular motion can be divided into three categories, which all have different associated energies and time scales: translational, vibrational, and rotational motions. The translational motion describes how the center-of-mass of the molecule (the molecule as a whole described as a point mass) moves in space. If the electron is emitted from a molecule flying towards the detector at 800 km/h, the kinetic energy of the electron will be larger compared to the case when the molecule flew in the opposite direction. In the measurements, we can observe this phenomenon through the broadening of the kinetic energy distributions of the measured electrons, which is thus called translational Doppler broadening. Basically the phenomenon is very similar to the “macroscopic” Doppler effect, seen for example in the sound waves: the sound of the siren of an approaching police car is higher pitched than of the one that is receding. As in this study the gas phase sample, the molecules are randomly oriented; the translational Doppler effect only widens the distribution of kinetic energies (there are equal amount of molecules flying towards the detector as away from it), but does not introduce any asymmetry.[1] The effect is small: as a worst case scenario for the lightest molecule studied in the work of Patanen et al., with the highest kinetic energy of the electron (308 eV) the translational Doppler effect introduces an additional broadening of 0.027 eV to the energy distribution of the electrons.
Apart from the electrons, the nuclei of the molecule are also quantum mechanical objects and obey the same rules of quantum mechanics. This implies for example that the nuclei move with respect to each other all the time, and the energy of this motion is quantized: it can have only certain energies called vibrational energies. It is like you would have a spring that you can stretch 5, 10, or 15 cm, but not 12 cm. The allowed stationary states are called vibrational levels. How do the vibrations affect the electron energies? Since the electrons are much, much lighter than the nuclei and thus much faster, they adapt immediately to the change of the molecular potential induced by the change of the distances between the nuclei due to vibrations. On the contrary: when an electron is ionized from a core orbital by an X-ray photon, the nuclei are so slow that they do not react immediately, but at the very moment of the creation of the core ionized state the molecule has the same geometry as the initial neutral molecule. During the ionization, however, part of the energy of the photon can go into the excitation of vibrational levels of the ionized molecule, in which case there is less kinetic energy available for the emitted electron as dictated by the energy conservation law. As the energies of the vibrational levels are quantized, there are energy losses of the emitted electrons at discrete energies, and one can observe a series of peaks corresponding to a single orbital photoionization. In their work, Patanen et al. did not study individual vibrational peaks but all of them at a time, so the observed asymmetry cannot result from the vibrational asymmetry.[2] The third motion, the rotation, also introduces broadening of the kinetic energy distribution via the rotational Doppler broadening, similar to the translational Doppler broadening, but being in general a smaller effect (ref. 1).
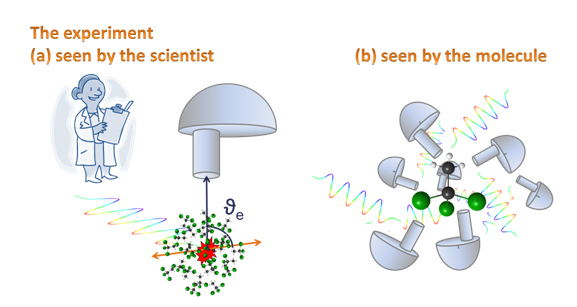
The other key point is the selection of the coordinate system: we are observing the angular distributions in a coordinate system which is defined by the polarization vector of the synchrotron light and the detection axis of the electrons. This is called the laboratory frame. You might remember from Einstein’s special relativity how important is it to define a proper coordinate system, and how it affects the results of the measurements. Think about a beamline scientist on his/her free weekend travelling with Eurostar to London: his/her velocity with respect to a fisherman in the coast of Calais is 300 km/h. However, in her own coordinate system she stays still and it is the Calais’s fisherman who is speeding. In our measurement, the laboratory frame is defined by the polarization vector of the synchrotron radiation and the detection axis of the electron spectrometer. In this coordinate system, our gas phase sample is randomly oriented – like mentioned above, even the heaviest molecules are flying at over 800 km/h, and are rotating as well. Is there a contradiction between the randomly oriented sample and the first key point that stated that the molecules are principally staying still on the time scale of the electrons’ emission? No, since the photoionization event “takes snapshots” of this ensemble of randomly oriented molecules, and statistically we are averaging over all possible orientations of the molecules. Another commonly used coordinate system in photoelectron spectroscopy is the molecular frame, implying that the coordinate system moves with the molecule in space, or to be correct the laboratory (electron detector, synchrotron light) moves![3]
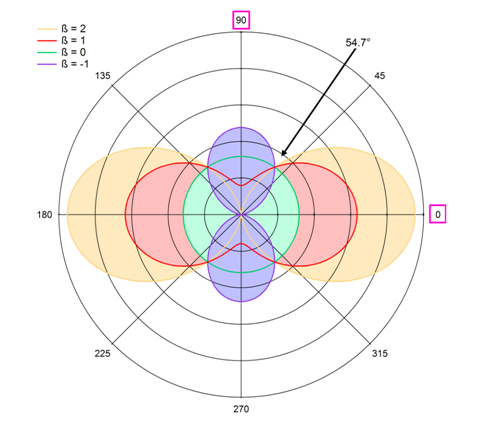
In order to understand the significance of the b parameter, let us first consider only an isolated carbon atom. In principle, in the ideal case, the C 1s photoelectron of an isolated carbon atom exhibits at all energies angular distribution with a b = 2, shown in Figure 2 with orange color. In this plot, the polar angle is the angle between the polarization vector and the emitted electron. We can see that in this case the electrons are preferentially emitted along the polarization vector. If b = 0, the angular distribution is completely isotropic. In the other extreme, if b = -1, the maximum of the distribution is perpendicular to the polarization vector. It is worth mentioning that present discussion is true within the so-called dipole approximation. This approximation is valid if the wavelength of light is much larger than the dimension of the atoms (the wave is not varying inside the atom). The smallest radiation wavelength used in the study of Patanen et al. was 2.1 nm, while the whole molecule is 10 times smaller, and it is thus safe to assume that the dipole approximation is valid.
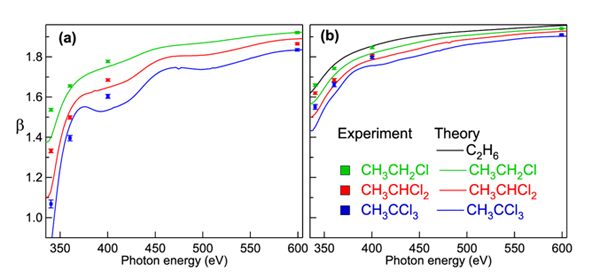
So, one would expect to see a lot of electrons when performing a measurement at 0° angle, and very few electrons when performing it at 90°. This is also what was observed in principle. However, the difference between the 0° and 90° angles was smaller than expected, and changing as a function of the photon energy. From the measured intensities the researchers were able to extract the b parameter, shown in Figure 3 together with theoretical calculations. Figure 3 a) shows the result for the chlorine substituted carbon and Fig 3 b) for the methyl carbon in a series of chloroethanes. One can see that the more chlorine atoms are present in the molecule, the more the b parameter differs from 2. Also, the deviation from this value is larger at the lowest ionization energies.
A simple physical picture describing the effect of scattering on the electron angular distributions is depicted in Fig. 4. for the CH3CCl3 molecule with different polarizations and ionization continua. As this is the case in nature in general, in molecular physics the symmetry of a molecule is a very important property, and it has a profound meaning in physics. The molecules can be classified in different symmetry groups, according to how they behave when different symmetry operations like rotations along axes and reflections are applied to them. The symmetry of CH3CCl3 is C3v (in short, the molecule looks exactly the same if it is rotated 120° around the carbon-carbon axis, and on the other hand, it also looks the same if it is reflected in a plane that includes the carbon-carbon axis and goes through one of the Cl and H atoms). The C 1s orbitals have also their own symmetry, and they are called 2a1 (chlorinated C) and 3a1 (methyl C). According to the dipole approximation selection rules, the ionization of an a1 orbital leads to a continuum wave (photoelectron, which is of dual wave and a particle nature!) of A1 or E symmetry. In the dipole approximation the photoelectrons with E symmetry will preferentially be “selected” by the molecules with their molecular axis perpendicular to the polarization vector. So if the detector is at 90° (perpendicular to the polarization vector), no signal should be detected. In the case of the A1 continuum, the molecules with the molecular axis parallel to the polarization vector will be preferentially “selected” and again, no signal should be detected in an analyzer at 90° angle. However, the researchers observed significant signal also when the electron detection axis and polarization vector were perpendicular to each other. This lead them to think that the intramolecular scattering redirects the electrons from their preferential trajectories (the sketched arrows in Figure 4), and the signal at 90° angle increases, which makes the angular distribution more isotropic and thus the β parameter smaller. The slower the electrons are, the more probable it is that they scatter and thus the β differs more from the ideal value 2 at low energies. Also, the more chlorine atoms the molecule contains, the more isotropic the electron angular distributions are. This is because the bigger chlorine atoms have larger scattering cross sections compared to the much tinier hydrogen atoms. It should be mentioned that the neighboring C atom is a scatterer as well.
In conclusion, the work by Patanen et al. demonstrated that the intramolecular electron scattering affects the photoionization angular distributions in the laboratory frame also far from the photoionization thresholds. The chemical sensitivity of the photoelectron spectroscopy technique made it possible to investigate separately the behavior of substituted and non-substituted atoms within a molecule, however under exactly the same experimental conditions, underlining the importance of the scattering. This observation suggests that, in addition to the total cross sections, the electron angular distributions are an alternative investigation tool for the molecular structures.

[1] However, there are studies where the sample molecules are (partially) aligned due to a resonant excitation and thus exhibit angular asymmetry. This is however, another story and the reader is recommended to refer to O. Travnikova, J. C. Liu, A. Lindblad, C. Nicolas, J. Söderström, V. Kimberg, F. Gel’mukhanov & C. Miron, Circularly Polarized X Rays: Another Probe of Ultrafast Molecular Decay Dynamics, Phys. Rev. Lett. 105, 233001 (2010) and references therein for further information.
[2] It is by no means to be assumed that each individual vibrational sub-level exhibits the same angular asymmetry, especially when the kinetic energy of the emitted electron is small (close to the photoionization threshold), or the ionized states are achieved via resonant excitations (see for example A. Lindblad, V. Kimberg, J. Söderström, C. Nicolas, O. Travnikova, N. Kosugi, F. Gel’mukhanov, and C Miron, Vibrational Scattering Anisotropy in O2 – dynamics beyond the Born-Oppenheimer approximation, New J. Phys. 14, 113018 (2012).
[3] In practice the molecule can be “fixed in space”, for example by determining its molecular axis orientation with respect to the polarization of the light when detecting the fragment ions after core-ionization.
Reference :
1 T. D. Thomas et al, Phys. Rev. Lett. 106, 193009 (2011).