On-line atmospheric aerosol formation analysis
A reaction chamber was coupled to a photoionization aerosol time-of flight mass spectrometer on the DESIRS beamline for on-line analysis of organic and inorganic-organic mixed aerosols using synchrotron tunable vacuum ultraviolet (VUV) photons as the ionization source. For the first time it was possible to detect and decipher the aerosol and gas phases. These results are published in the European Physics Journal D.
Primary and secondary organic aerosols (POA and SOA) are ubiquitous through the atmosphere making a significant contribution (~20 to 50% at continental midlatitudes and up to 90% in tropical forested areas) to the total mass of fine aerosols. Both classes have different chemical compositions as well as diverse physical characteristics that affect Earth’s climate, visibility, atmospheric chemistry and human health. In order to understand the mechanism of aerosol formation and their atmospheric aging, a number of methods are used for both on-line and off-line analysis. Most of these methods are based upon mass spectrometry due to its high sensitivity and rapid analysis. However, universal and unambiguous compound identification is still very challenging due to the high energy used in common mass spectrometers which leads to unwanted fragmentation. The tuneable VUV synchrotron radiation can be controlled to achieve “soft” ionization, avoiding fragmentation and facilitating compound identification. Moreover, it allows isomer identification and differentiation by recording the photoelectron efficency curves as a function of photon energy in coincidence with the mass-selected ion.
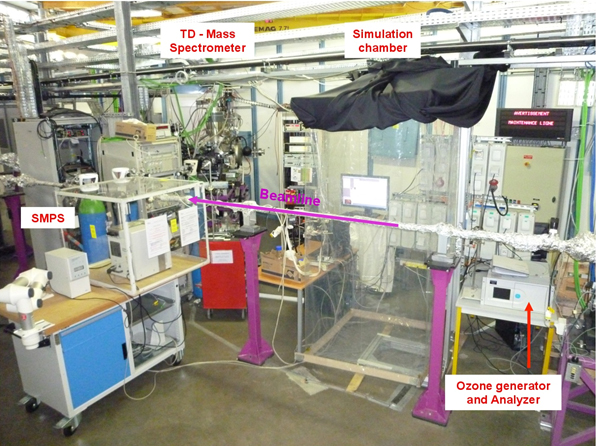
“At SOLEIL, we have coupled an aerosol chamber to other atmospheric tools like a SPMS (Scanning Particle Mobility Spectrometer), ozone monitor, etc. to study aerosol formation processes” (see Figure 1) says María Teresa Baeza_Romero, main author of the study published in the European Physics Journal D.
Ozonolysis of α-pinene
Using photoelectron-photoion coincidence techniques – where the scientists are capable of matching the electron and ion that come from the same photoionization event in time – they obtained isomer information about one of the components of the SOA (m/z 184) formed after ozonolysis of α-pinene.
A homemade indoor collapsible PTFE 2 m3 chamber, with several inlets to introduce chemicals and to sample formed aerosols in the middle of the chamber, was specifically designed for this study (see Figure 1). One sampling port is connected to a Scanning Mobility Particle Sizer from TSI (SMPS: DMA model 3080L coupled to a butanol-CPC model 3775) for size distribution measurement of aerosols, and another one to the synchrotron VUV-PEPICOMS (PhotoElectron/PhotoIon COincidence Mass Spectrometer) inlet. During the experiments, the chamber was in dark conditions, and all ozonolysis experiments of α-pinene were carried out in dry conditions. Ozone was injected inside the chamber using an ozone generator (Kaufmann Umwelttechnik, model OZMT) and monitored by an ozone analyzer (Horiba, model APOA-370).
The aerosols were sampled from the smog chamber through a 6mm Teflon tube and were introduced in an aerodynamic lens system with transmission efficiency close to 100% for particle diameters ranging from 100 nm to 1.5 µm. At the lens output, a particle beam of diameter less than 0.35 mm is formed and introduced in the spectrometer chamber, where the particles collide against the thermodesorber (TD), located very close (1mm) to the centre of the ionization region. This TD is made of porous tungsten and can be heated up to 553K. In order to softly volatilize the aerosol, the TD temperature was set to 423K for ozonolysis. Once the aerosol is vaporized, it produced a quasi-continuous plume containing the molecular building blocks of the aerosols that are subsequently photoionized with the SR-VUV. The ionization source (8.5-11eV, energy range for this work) was delivered by the variable polarization VUV beamline DESIRS.
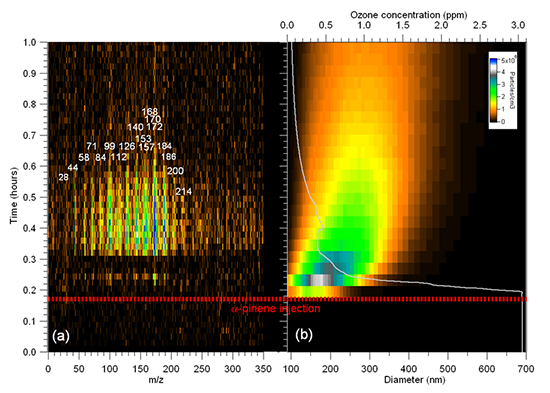
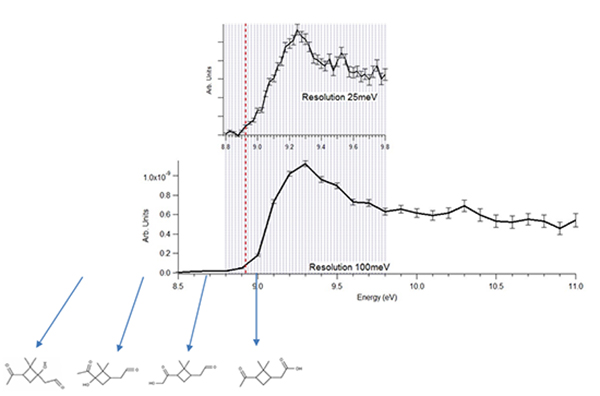
Figure 2a presents a typical 3D mass spectrum - intensity vs (time, m/z) - obtained by sampling the aerosol and gas phase products from the α-pinene ozonolysis. This figure shows only the first hour of the reaction. The ozone concentration and aerosol size distribution measured in real-time are also presented in Figure 2b. While the O3 signal decreases rapidly after the injection of α -pinene, there is a time lag for the appearance of ion signal in the MS (Figure 2a). In Figure 2b it can be seen that as soon α -pinene is injected in the chamber, fast nucleation events appeared. The aerosol distribution size keeps growing and broadening with time, as illustrated in the typical banana-shape seen in Figure 2b. After some time, the ionization efficiency can be measured as a function of photon and electron kinetic energy for any given mass in a multiplex manner. For this example we have chosen m/z = 184, a parent ion that can be assigned to different products (see Figure 3). The derived ionization energy (8.92 ± 0.02 eV) allowed us to discard the presence of 1-OH-pinonaldehyde and 1-hydroxy-2,2-dimethyl-3-oxocyclobutanal, by comparison with calculated values for the four possible isomers. A complete determination of the isomer population is however hindered by the lack of literature data on the photoelectron spectroscopy of these compounds, which decreases isomer sensitivity since the molecular structure determination is only based on the ionization energy comparison between theory and experiment. However it can be determined that two of the possible isomers of m/z 184 do not contribute, or are below the limit of detection.
The main advantages of synchrotron photoionization mass spectrometry for the study of aerosol formation processes are tuneability, spectral purity, which minimise fragmentation of the parent ion to facilitate mass determination, as well as high energy resolution and high photon flux to determine molecular structures from the recorded electronic structure of a given m/z. This is achieved here by recording the ion signal vs. the photon energy and photoelectron kinetic energy simultaneously. This electron/ion coincidence technique may find a wide range of applications in aerosol research, especially since the sensitivity has recently been increased by a 20 factor through the commissioning of a new aerodynamic lens for aerosol transport into the spectrometer, which brings closer to matching the low atmospheric concentrations. Finally, a new thermodesorber design has been already tested with a thinner profile, and a higher maximum temperature, which should increase the electron energy and ion mass resolution by minimising its spurious effect on the electrostatic lenses, and overcome some of the vaporization limitations observed in this work.