3D imaging of in situ enzymatic reactions
Green chemistry is booming, fueled by the growing interest in probiotics (and their impact on human health) and biofuel production. Thereby, the scientific community is increasing studies on the enzymatic degradation of biopolymers such as starch and lignocellulose. Hydrolysis of these solid substrates can last several hours and varies according to their semi-crystalline structures, which can limit the diffusion of the enzymes and thus reduce their degradation.
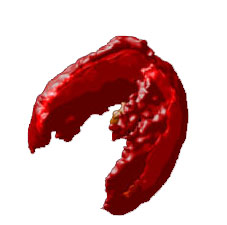
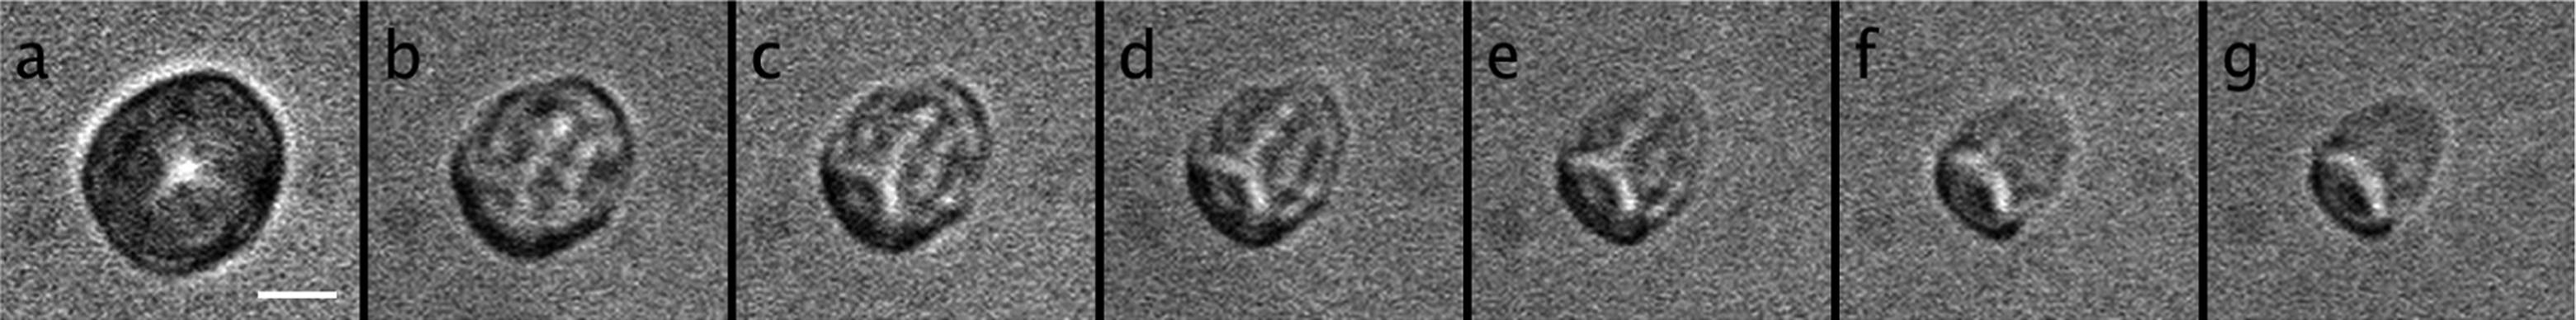
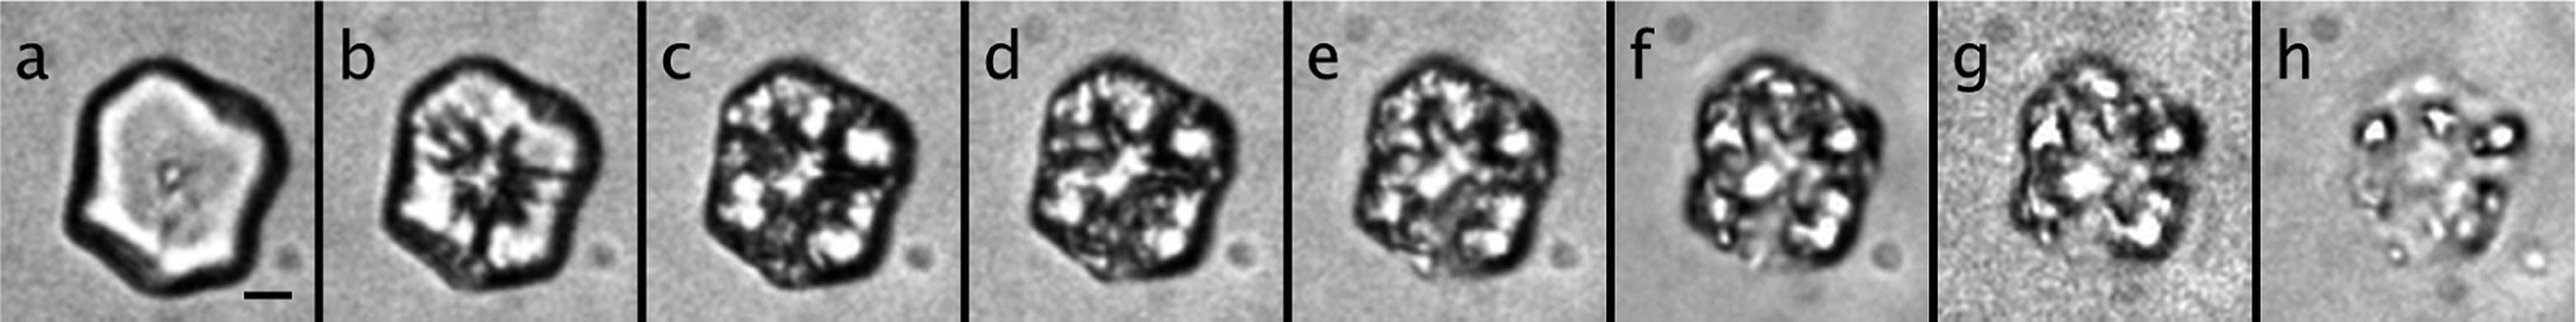
A study carried out by the researchers from SOLEIL's DISCO beamline, INRA (BIA, Nantes, France) and Novozymes (Novozymes A/S, Krogshoejvej 36, 2880 Bagsvaerd, Denmark) allowed for in situ tracking of the degradation pathways for two enzymes of the amylase family (called AFA and RA) optimized for biofuel production. The hydrolysis of starch grains was followed by tryptophan fluorescence (in the deep UV region). A wide-field microscope developed on the DISCO beamline has allowed researchers to obtain a 3D representation of the enzyme-substrate interaction during the reaction, for up to 10 hours. It is the first time that a device without any fluorescent probe has allowed for a 3D tracking of starch grain degradation.
The researchers highlighted that this phenomenon varied considerably from one granule to another, and more specifically, from one enzyme to another. Although both amylases first tend to attack the thickest part at the center of the granule, they do not diffuse in the same way throughout hydrolysis. The 3D tracking made it possible to identify two antagonistic degradation pathways with, in particular, an RA action spreading from the center towards the outside of the granule. This difference is most likely due to different biding potential between the two enzymes, never observed in 3D until now.
The researchers on the DISCO beamline were eventually able to use an original method to track reactions by autofluorescence, i.e. without incorporating a substance in the medium that would be likely to influence the results. This 3D tracking method is a particularly effective tool for improving our knowledge of enzymatic mechanisms, and could open the way to new opportunities in the fields of analytical chemistry, sustainable development, biotechnology and biofuels.